Community Hubs Australia - Datathon for Social Good
Award Winner: Best Individual
“If you want to lift yourself up, lift up someone else.”
- Booker T. Washington

Community Hubs Australia - Datathon for Social Good
Report by Áine Phelan and Patrick Healy
Context
We participated in Melbourne’s first Datathon for Social Good, serving Community Hubs Australia (CHA), a not-for-profit organisation which helps to build social cohesion Australia-wide, particularly amongst the migrant community.
Community Hubs and their programs are gateways that engage and support migrant women with young children, where isolation can be a serious social issue. There are already dozens of hubs in operation, and future plans to expand. Hubs are hosted in schools to provide a range of activities for children and adults, such as English lessons, maternal and child health, and playgroups. They provide welcoming places for migrant families, and especially these mothers, to come and connect.
The challenge in this highly motivating datathon was to use the provided data to further insight into the activities and impacts of Community Hubs.
Data
The original datathon repostitory can be found here.
Problem Statement
Out team chose the Internal Data Track challenge. Our challenge was to use internal organisational data to answer questions such as, “What is a ‘typical’ hub and what is an ‘outlier’?”
In addition to the above prompt, we were encouraged to be as creative as we liked, should any we see any other way of using the data to help CHA ongoing.
All internal hub data was anonymised - we had no contextual data such as location, demographics, school or hub size to inform our analysis.
Scope
Our report is comprised of 2 main parts:
1. Analysis of the ‘Typical Hub’ based on Key Measures of Success
We took the approach of focusing on the measures of success important to CHA, as advised to us during the datathon briefing. These included (but were not limited to)
- Engagement
- Diversity of programs
- Ratio of activities for children to those for adults
For these and other measures detailed in this report we created
- a distribution of values for each measure - finding the ‘typical’ values, the general ranges, and also noting extreme outliers
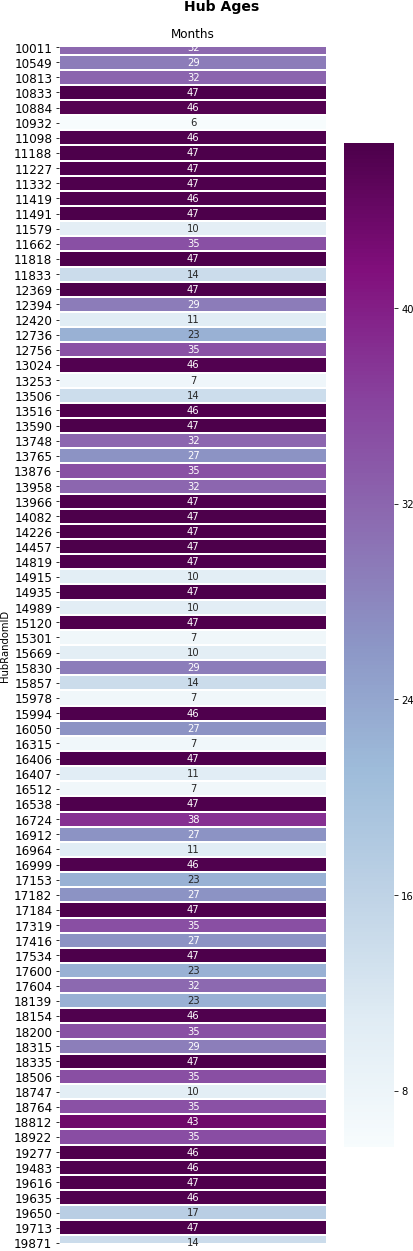
- a breakdown of these values at an individual hub level - mapping a value back to its hub, and using heatmapping to compare these values to each other at a hub level
We have come at each key success measure in a variety of different ways, looking at each from multiple angles, as we believe that multiple contexts are crucial to help give as full an understanding of the data as possible.
2. Creation of a Hidden Markov Model
Another key measure of success was hub performance over time.
To assist with this measure we worked on a Hidden Markov Model (HMM), which would enable the oganisation to compare a single hub to itself over time, predicting a hub’s performance based on its own past behaviour. For example, comparing a hub’s observed sequence of activities to its number of participants, to see if we can use activities to predict attendance as a measurement of performance.
Working within the time contraints we have modelled on one hub only as a proof of concept. Future work would include modelling on other hubs to cross validate our results.
Data Considerations
Program Categories
Due to time and resource constraints, for the purposes of our analysis we decided to narrow our focus to activities belonging to the the following categories of programs only
- Programmed Activities
- Education and Training
We chose these two categories to focus on for the following reasons
- Of the four categories we felt these two most represented CHA’s core business. They are frequent, regular and are proactively planned and scheduled. Importantly, these are the categories hubs have most control over, and they form the overwhelming bulk of CHA’s interactions with the community
- Other categories (One Off Events and Service Referrals) appeared more ad-hoc, reactive and irregular, and we found issues with data availability and reliability. For example, though many Service Referral activities were recorded, there was an almost total lack of participants recorded. In short, there were more questions here than we felt we had time to answer. More time and resources permitting, these categories would make a great addition for future work, allowing a more complete picture of hubs to be painted
Participants
Based on advice from CHA representatives, we focused our analysis on Child and Adult participants only.
Activity Dates
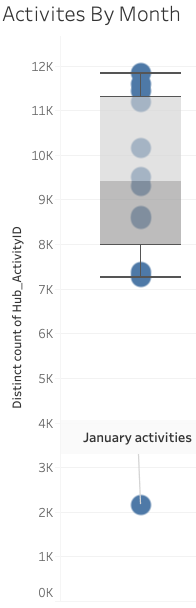
When analysing for “typical” behaviour, we found the data was heavily skewed by the month of January, with the number of activities proportionally much smaller here than for any other month.
Thus, we made the decision to treat January as an extreme outlier and, where we deemed necessary, removed it from our analysis.
Technologies Used
Python, Jupyter Notebook, Rmarkdown, Tableau, Excel
1. What is a Typical Hub?
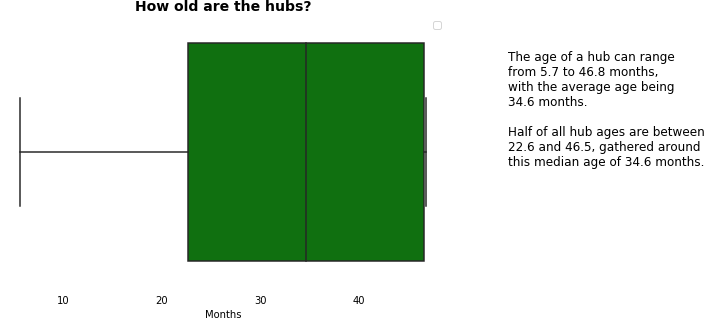
1.1 Hub Age
We first took a look at how long hubs had been running - across all hubs, at an individual level, and compared with one another.
Informative in its own right, hub age and derived from this, what we considered ‘active months’ (i.e. excluding January), would also inform many of the other key measures in the following sections.
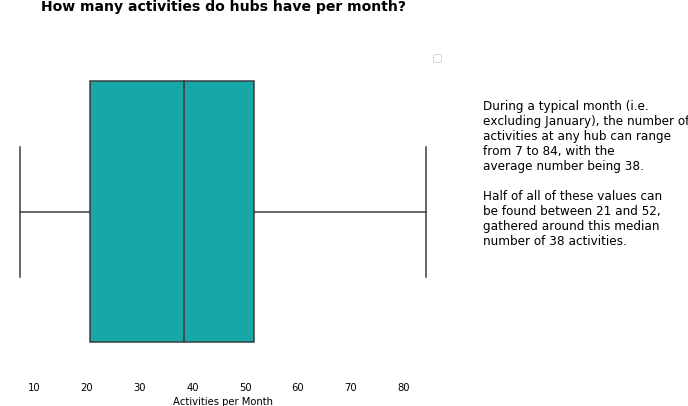
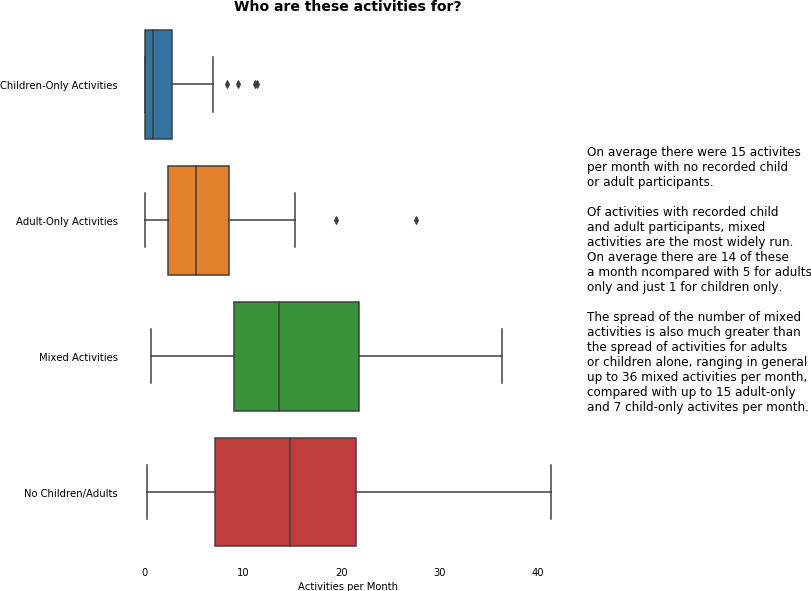
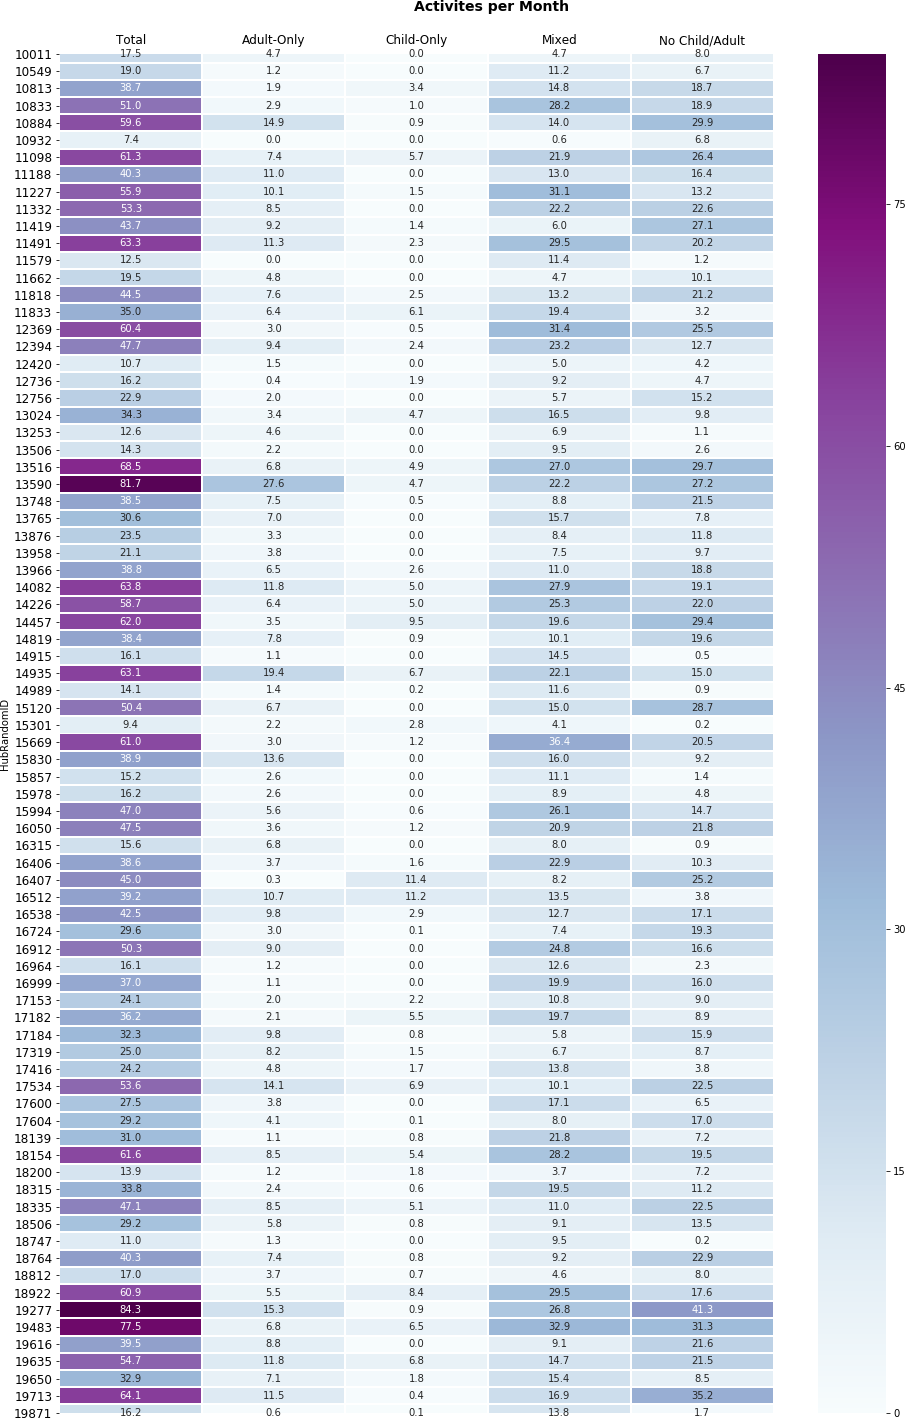
1.2 Hub Activities
Here we took an initial look at activities, answering questions such as
- how many activities do hubs run?
- who do these activities cater to?
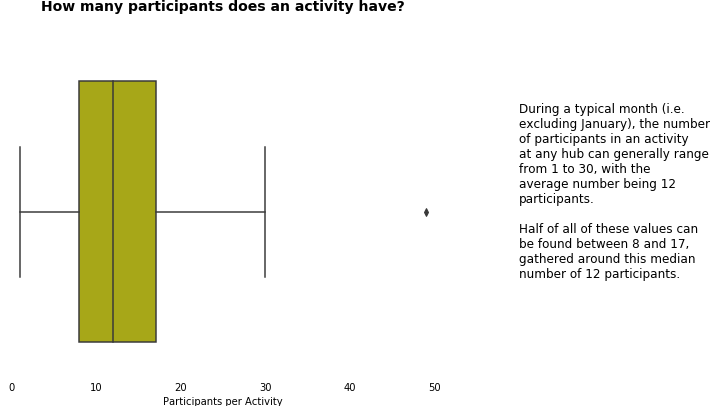
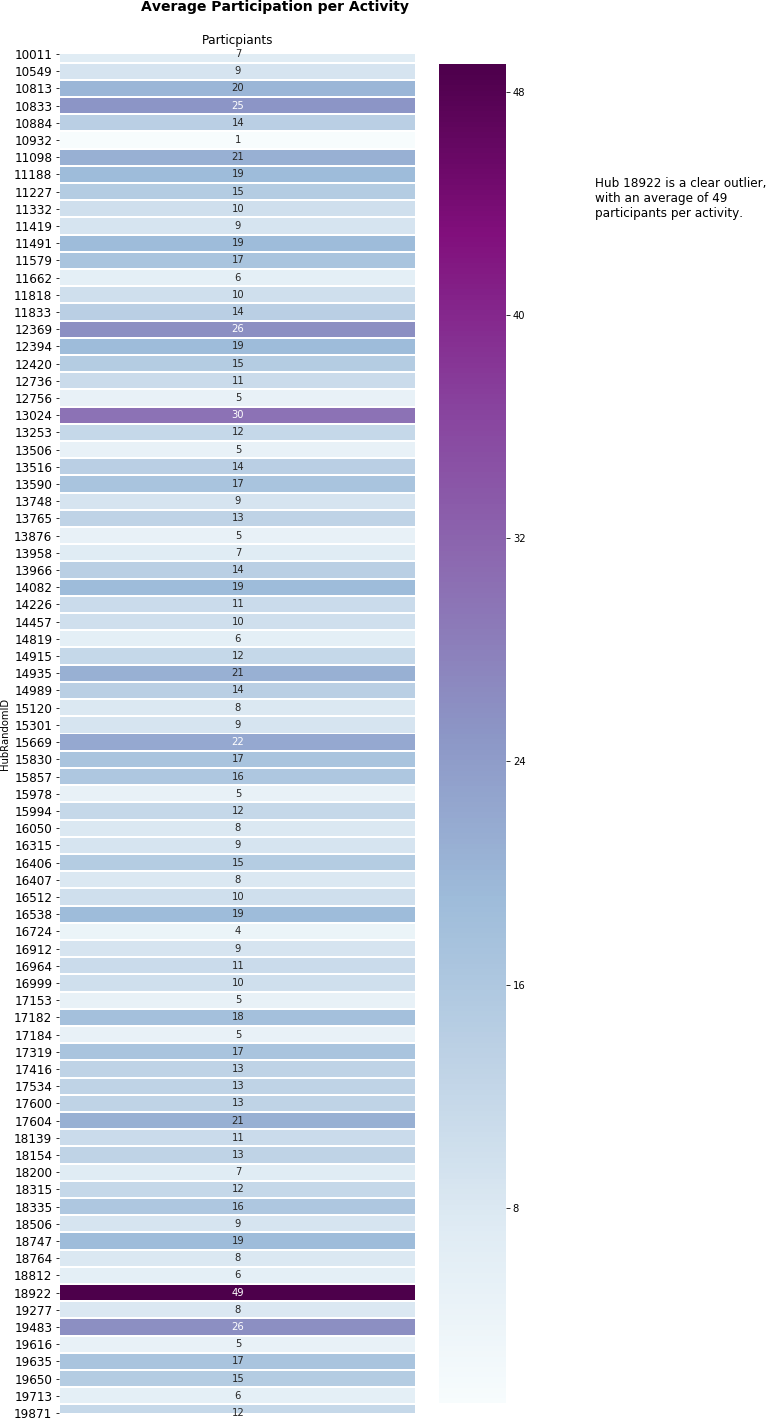
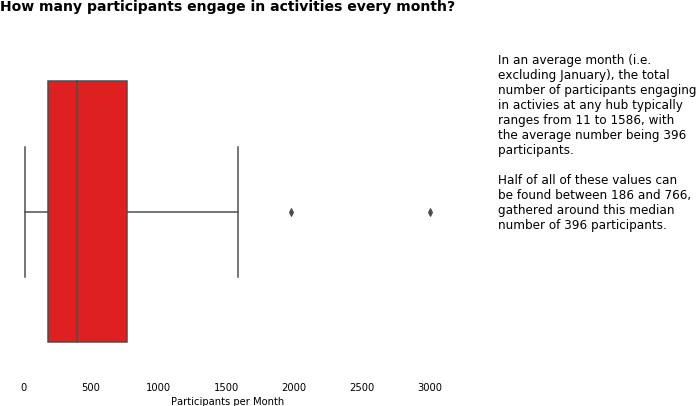
1.3 Engagement
A key measure of success for CHA, in this section we dove into the data on participation to help us understand how engaged the community was at each hub.
At a general and an individual hub level, we asked and answered questions to do with
- average participation per activity
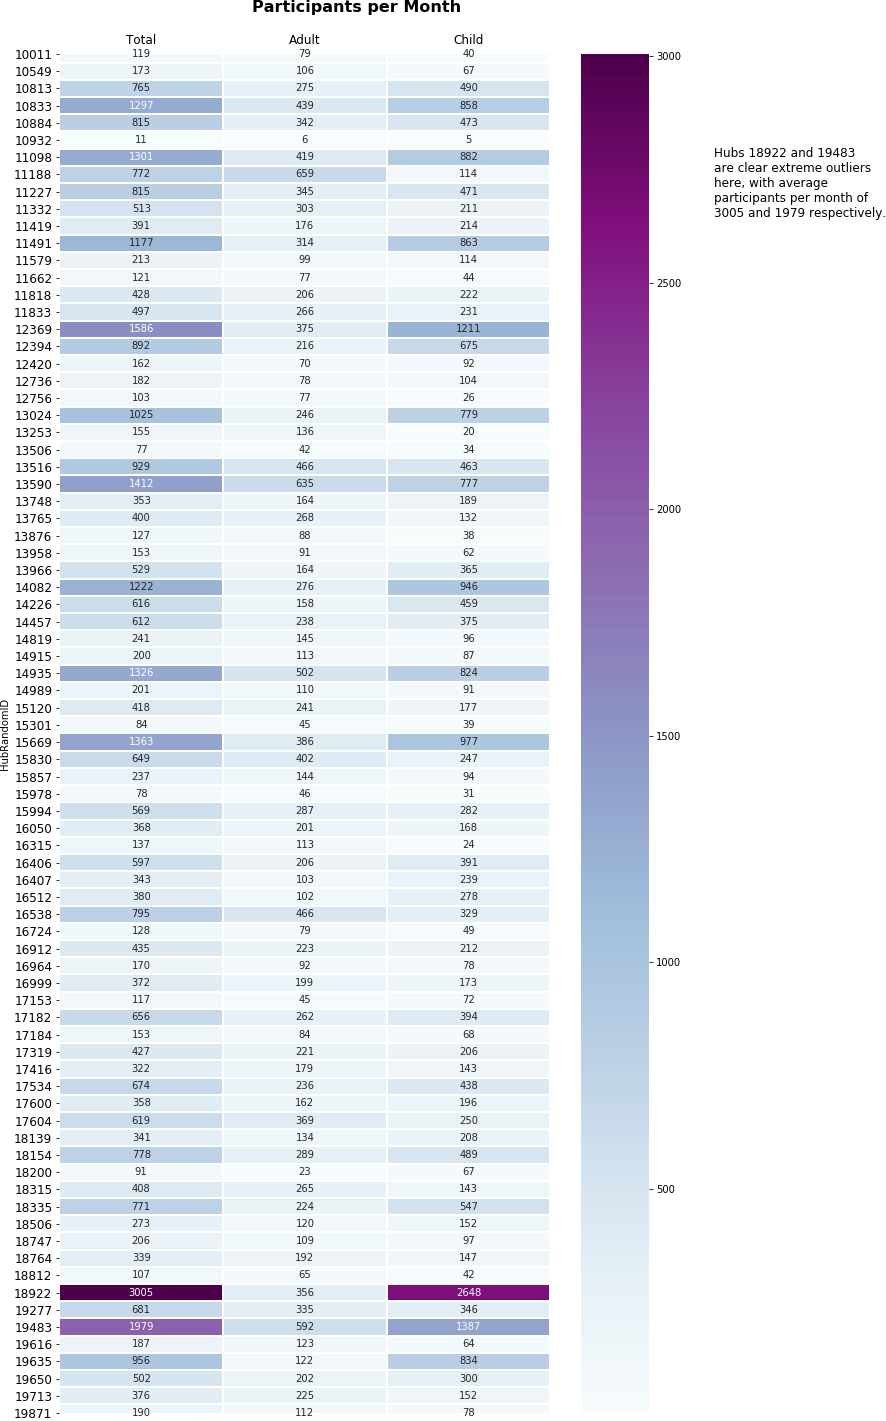
- throughput of participants per month
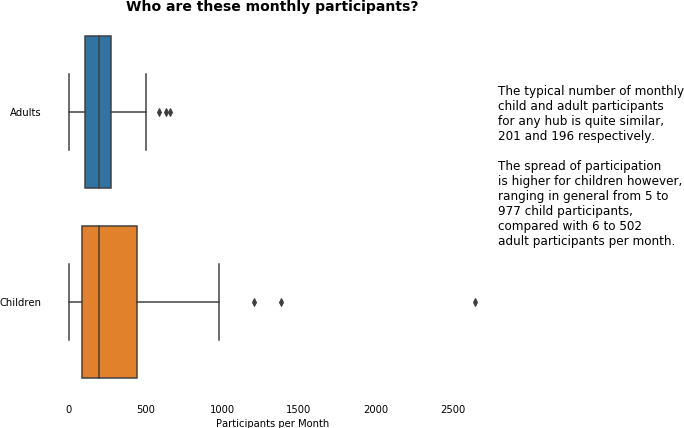
- the breakdown of participation by adults and children
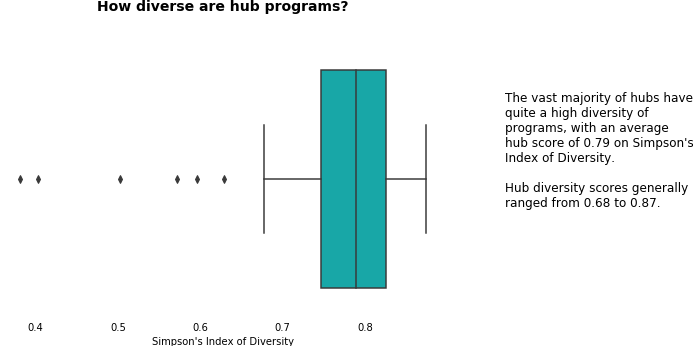
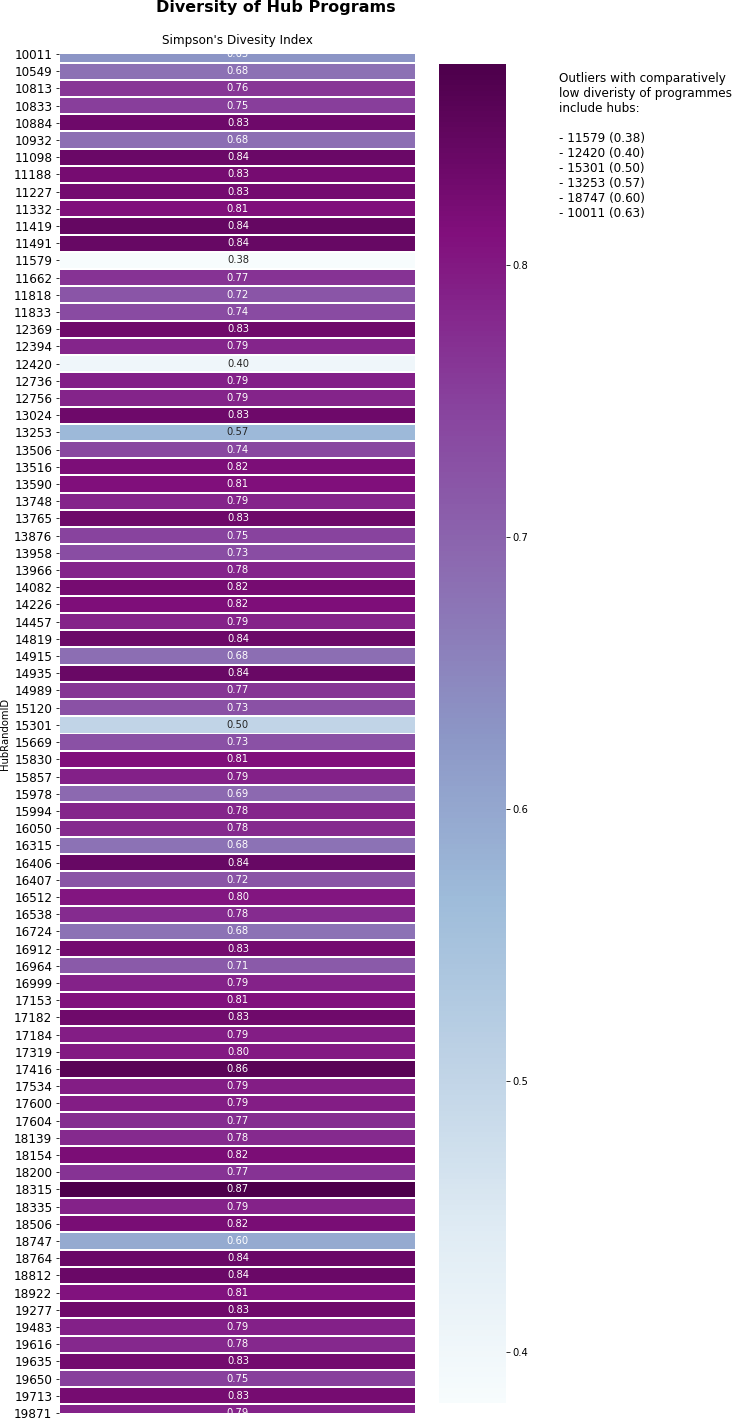
1.4 Diversity of Programs
Another key measure of success, this section measures and compares hubs on the diversity of programs offered.
Looking to Ecology and Information Theory, the concept of diversity can be quantified taking 2 main factors into consideration
- Richness - the number of different species in a sample. The greater the number of species, the ‘richer’ and more diverse the sample is
- Evenness - the relative abundance of these species. The more evenly distributed the number of individuals in different species are, the more ‘even’ and diverse the sample is
So, for hub programs to be highly diverse, we need to see hubs with
- a high number of different programs on offer
- an even distribution of activities within each of those programs
For our calculations we used Simpson’s Index of Diveristy, which ranges from 0 to 1, with 0 being least diverse, and 1 being most diverse.
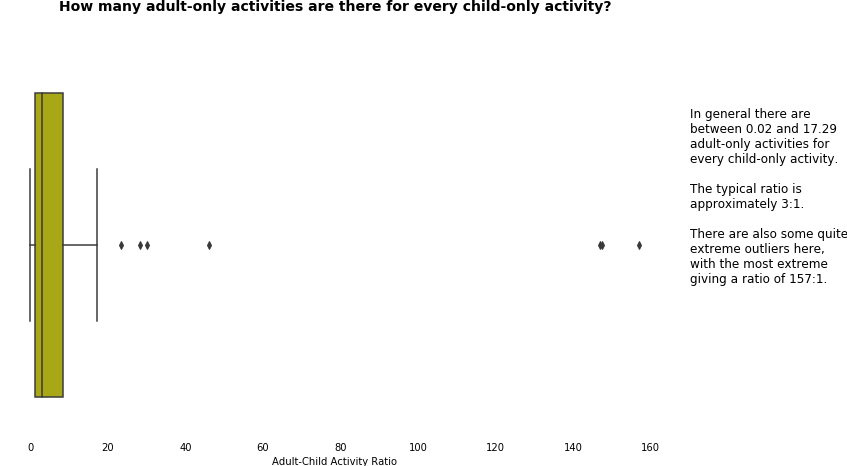
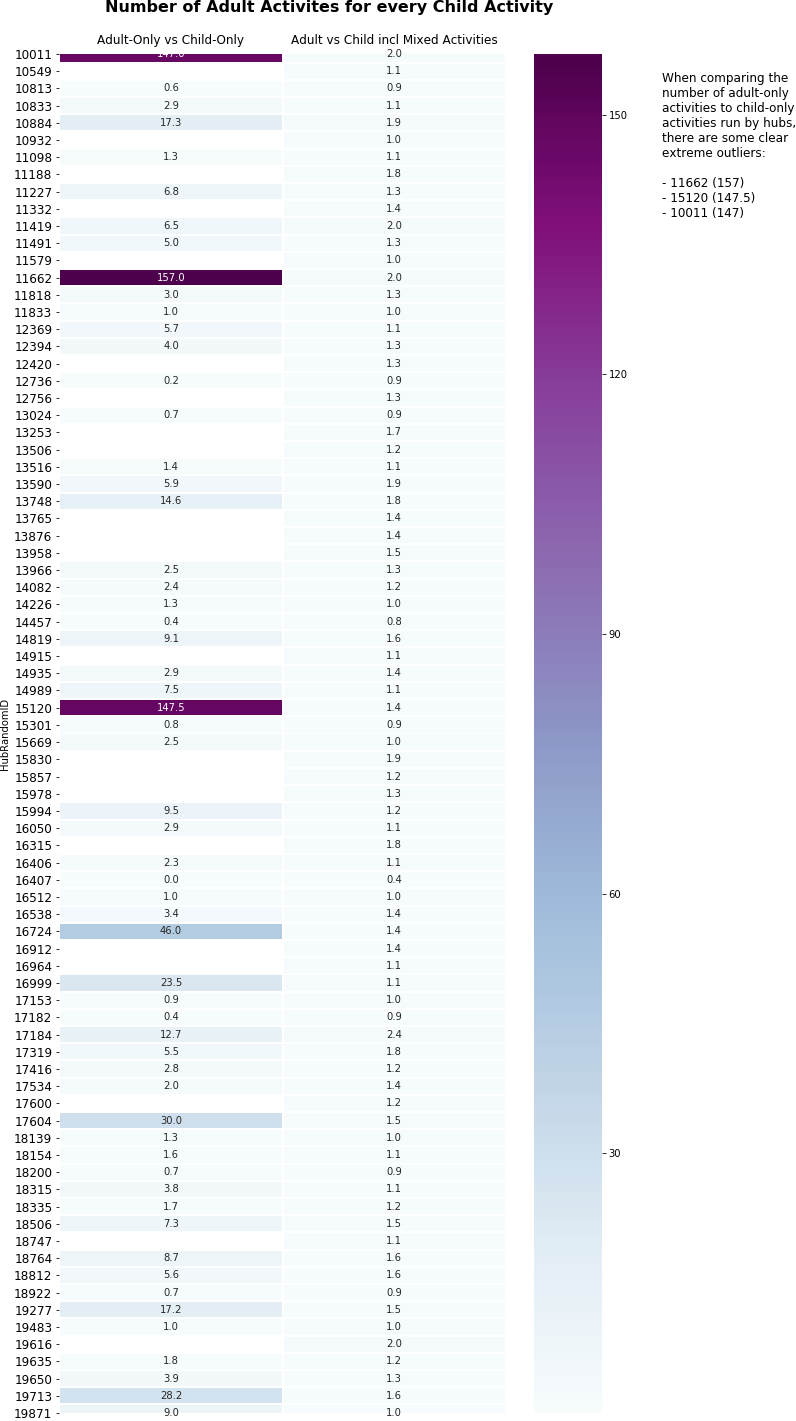
1.5 Ratio of child to adult activities
In this section we addressed another key success measure, asking ourselves questions about the proportion of activities on offer to adults, compared with those on offer to children.
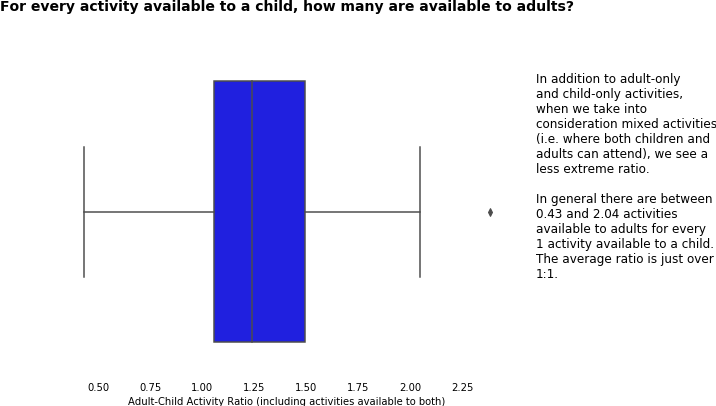
Again, we came at this in a number of different ways to help with our understanding, looking at
- adult-only and child-only activities
- mixed activities (those where both children and adults attended)
It is worth noting in that the following ratio could not be calculated for all hubs, as there were
- 20 hubs with 0 child-only activities
- 2 hubs with 0 child-only and 0 adult-only activities
2 Hidden Markov Model
Can we predict the performance of a hub compared to its average attendance using hub data?
Due to Covid time pressure we started with a single hub to examine the potential of this approach. Note that the results have not been cross validated.
Using Hub data we implement a Hidden Markov Model to show that observed hub activity can be used build a generalized method for forecasting hub performance.
2.1 What is a Hidden Markov Model?
A Hidden Markov Model uses Markov chains to try and make a prediction about the future based on the sequence of events we have observed in our data.
To outline the relevance of this model we will highlight an example described by Eisner (2002). Suppose we want to study the sequence of Hot(H) and Cold(C) days to predict how much ice-cream our Neighbor will eat every day. If we have observed how many ice-creams our neighbor has eaten over three days (e.g., 3 1 3) for a given sequence of weather (e.g., H H C) we can estimate the likelihood of this many ice-creams being eaten each day. As we build up more information we can begin to forecast how many ice-creams our neighbor will eat.
2.2 How do HMM’s apply to Community Hubs Data?
Using a HMM we can forecast how a hub will perform in relation to its own past performance and then cluster hubs with a similar performance trajectory as well as hubs with similar predictors of performance.
What this means is that we want to group hubs with similar indicators for how they are performing based on scheduled activities across time.
We believe that a HMM is both better suited to the categorical data and also easier to implement than a Time Series Regression. When clustering is performed using categorical variables, these clusters are incredibly hard to transfer into a time series. We hope that applying a HMM will solve this problem. We take inspiration from Ghassempour et al (2014) who perform a time series cluster of medical data using the HMM.
This approach can be thought of as using machine learning to classify a time series to observe how similar hubs are tracking.
We hope that this will provide information about what types of classes are most in demand and what scheduling appears to be most accessible to each school and community.
2.3 Data preparation
First we choose a single hub 15994. Then we remove outliers and rows with zero participants. Our suggestion for predicting zero values is to explain their presence with clustering and by incorporating important dates such as holidays. This can be achieved with the R package Naniar (Tierney 2019).
Day of Week and Month of Year are taken from Activity Date as variables for our model.
2.4 Building the Model
We use the DepmixS4 package Visser, I., & Speekenbrink, M. (2010) in R for Hidden Markov Models. We use a multinational distribution to best capture the categorical distribution of the high dimensional data. We start with a 2 state model for simplicity. Our two states are
- State 1 Performing Below average
- State 2 Performing at or above average
To build an equation we start with a small number of variables. We choose variables which exist in all hubs and all years.
“ShortName”, “CategoryName”, “Month” and “Day” Month and Day are taken out of the time stamp using the Lubridate package in R and scaled from 0 to 1 for comparing the results between the two. Names are textual data and don’t need to be scaled.
We use Log Likelihood calculated from the DepmixS4 packaged to order the variables in our equation based on how they perform at predicting hub performance (from best to worst). This is done using a step wise approach. Find the first best variable, remove that from the process and repeat to find the next best variable and so on.
We want to test the hidden states predicted from the sequence of these variables against some actual states in the data.
For this we use an aggregate of “AdultParticipants” and “Child Participants” We use the difference between the (sum of Adult and Children participants for a single row) and (the mean Child and Adult participation for the entire hub) as an indicator for how a hub is performing compared to its own average. This is also scaled from 0 to 1.
2.5 Results
We find that our hidden states which actually match up to the Participation data extremely well.
- In state 1 there was a 66% probability of the hub having below average attendance
- In state 2 there was a 99% probability of having high attendance
As we have trained on quite a small sample size of a single hub we are quite skeptical of such a high probability for (State 2) and would expect this to drop once we look at more hubs.
These results sound promising but this is only a training model so the results are still quite unstable and need to be cross validated by testing on other hubs.
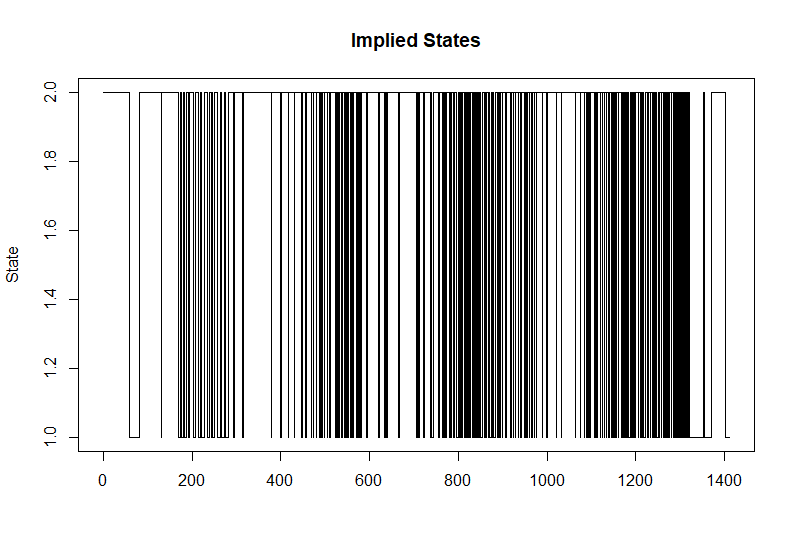
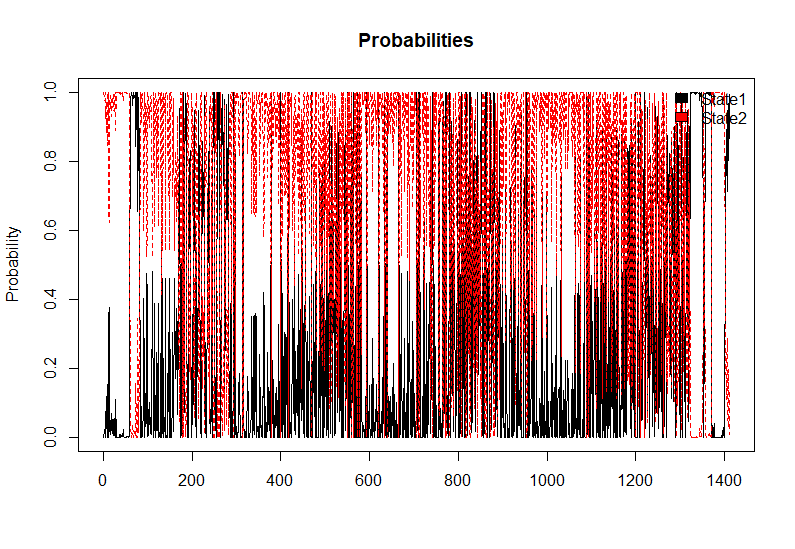
2.6 Visual Comparison
We use visuals to observe how well our predicted states match up to the actual performance of Hubs implied by the attendance figures.
Given the large variation in attendance week to week, these plots will look quite messy to if you haven’t seen them before. For example, what we want to see is that when there is a high probability of the hub being in an above active state (State 2) that this looks very similar to attendance at the same point on the X-axis. When we have a longer period of being in State 2 in (Implied State plot), we want to the corresponding probability line for State 2 (red) to be at the top in the (Probabilities plot).
This is largely what we see which is promising.
2.7 Conclusion and Next Steps
Run this training model for other hubs to cross validate the results.
Look to expand the equation to improve the prediction scores. And begin to cluster the hubs.
2.8 References
Eisner, J. (2002, July). An interactive spreadsheet for teaching the forward-backward algorithm. In Proceedings of the ACL-02 Workshop on Effective tools and methodologies for teaching natural language processing and computational linguistics (pp. 10-18).
Tierney, Nicholas, et al. “Naniar: Data structures, Summaries, and Visualizations for Missing Data.” R Package (2019).
Visser, I., & Speekenbrink, M. (2010). depmixS4: an R package for hidden Markov models. Journal of Statistical Software, 36(7), 1-21.
Ghassempour, S., Girosi, F., & Maeder, A. (2014). Clustering multivariate time series using hidden Markov models. International journal of environmental research and public health, 11(3), 2741-2763.
3. Recap
In summary, for this report we
- tackled the Internal Data Track challenge
- analysed hubs from the point of view of several key success measures believed to be the most important to CHA
- analysed hubs at general, individual and comparative levels, from a range of perspectives
- explored modelling how observed behaviour over time in an individual hub can be used to predict future performance
Thanks to CHA and the organisers for opening your doors to us for this challenge. This was a fantastic learning experience and we hope we were able to contribute in some meaningful way to the important work you are doing for women, migrants and those at risk from social isolation.