Tableau Dashboards
“To see a world in a grain of sand and a heaven in a wild flower, hold infinity in the palm of your hand and eternity in an hour.”
- William Blake, Auguries of Innocence

This page will be a home for my Tableau dashboards and stories. I’ll update with it new boards as I make them.
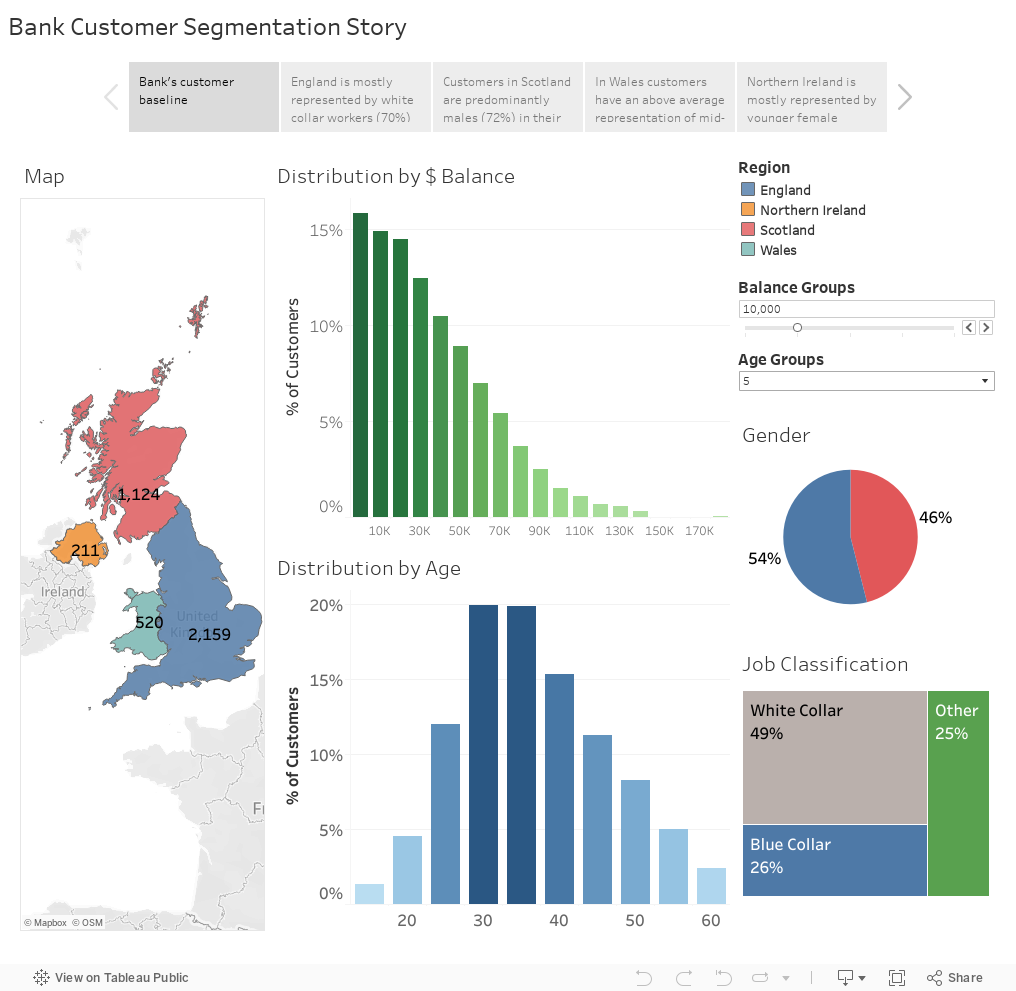
Story: Bank Customer Segmentation
The following story deep-dives into the customer segmentation of a fictitious bank in the United Kingdom. The original data set can be downloaded from here.
I have visualised data for customers’ geographic locations, bank balances, ages, genders and job classifications.
Click through the below story for some initial, high-level insights. Each page is interactive, and each feature acts as a filter for all other features, allowing you to further explore at a more granular level. You can also select different bin values for age and bank balance.
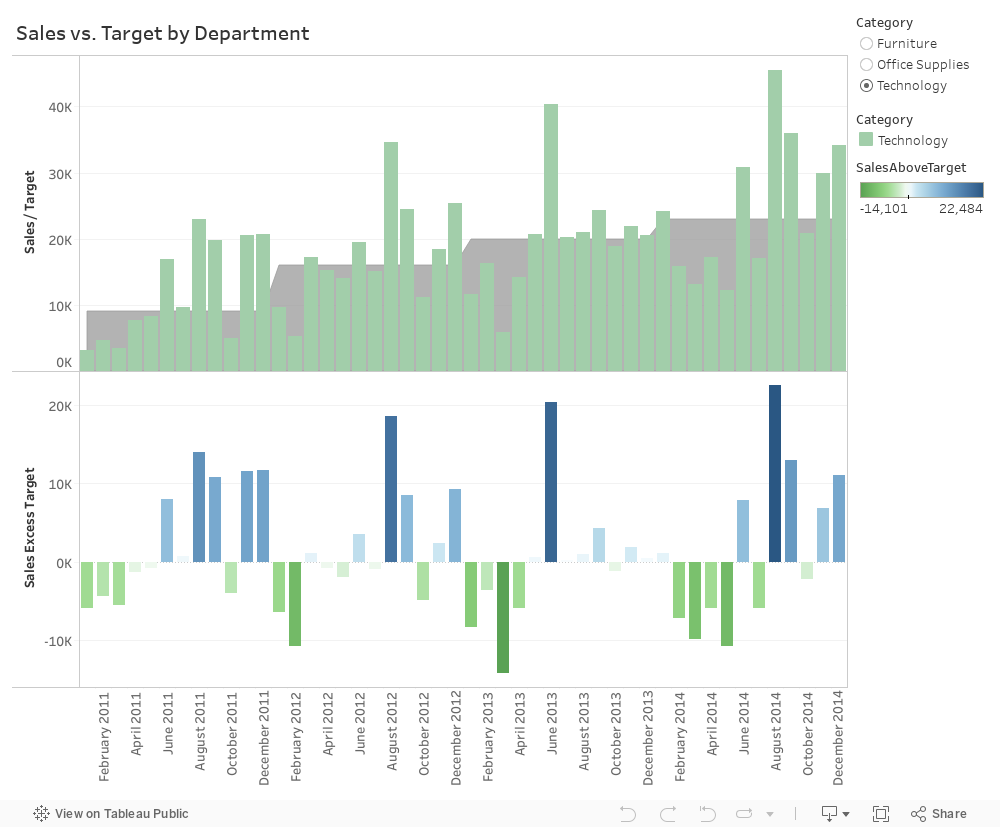
Dashboard: Sales vs. Target by Department
This next dashboard represents sales data for a fictitious supplier of office furniture, supplies and technology. The original data set can be downloaded here.
The dashboard compares actual sales across time with sales targets. You can filter on the different categories or departments on the right to see how sales have been tracking for each area. I've also included a visualisation of sales value above or below target, to give a clear picture of sales performance for that month for the particular department.